Everything you need to know about data observability
7min • Last updated on Feb 7, 2025

Olivier Renard
Content & SEO Manager
According to Gartner*, poor quality data costs businesses an average of $12.9 million a year. Yet less than half of them actually monitor the impact.
In a context where strategic decisions are based on reliable data, data observability (DO) guarantees its integrity and accuracy.
Key points:
Data observability aims to ensure that data is accessible and reliable. It helps to identify and correct errors, so as to avoid decisions based on incorrect insights.
It continuously monitors the health of data flows, which distinguishes it from data quality management.
Various specialised tools facilitate its implementation. They enable data quality to be supervised on a large scale.
An essential component of a Modern Data Stack (MDS), data observability improves overall performance. Reliable data facilitates decision-making, reduces costs and increases team efficiency.
👉 Discover how data observability guarantees reliable data and improves your strategic decisions. Explore its principles, features and the tools to implement it effectively. 🔎
Definition and importance of data observability
Data observability refers to the ability to continuously monitor, analyse and guarantee the quality of data.
It helps organisations detect issues, ensure data reliability, and make more informed strategic decisions.
Data observability influences an organisation's performance and its ability to make informed choices:
Impact on decision-making and the reliability of analyses. By rapidly identifying problems in data pipelines, it prevents decisions being taken on the basis of incorrect or incomplete insights.
Reduces the financial and operational risks associated with data errors. It avoids disruption and loss of confidence. It also ensures compliance with security, confidentiality and regulatory standards.
Improve the reliability and performance of data pipelines. It identifies bottlenecks and improves the efficiency of processing. This reduces latency and ensures a constant, reliable flow of data.
Observability vs Data Quality Management (DQM): understanding the differences
DQM and observability both aim to guarantee the reliability of data. However, there are important differences in their aims and scope.
Data quality management: definition and role
DQM aims to preserve the integrity of data throughout its lifecycle. It relies on manual and automated checks to identify duplicates, missing values and format errors.
It seeks to maintain high standards of data quality. The key players in the DQM are the Data Quality Manager, who is responsible for defining standards, and the Data Quality Analyst, who is in charge of day-to-day monitoring.
Data observability: a more global approach
Data Observability offers a broader, more proactive view, by monitoring data pipelines in real time.
This approach includes :
Continuous supervision: constant monitoring of data movements and changes in all systems.
Error detection: alerts identify issues, such as sudden peaks or breaks in data flows.
Advanced diagnostics: analysis of the origin of problems to speed up their resolution.
Although DO and DQM share the same objective, observability takes a more dynamic and automated approach. It focuses on the overall health of the data infrastructure.
It allows incidents to be spotted before they have an impact on results, thanks to global monitoring of pipelines. It meets the needs of businesses processing large volumes of data in complex environments.
Criteria | Data Quality Management | Data Observability |
|---|---|---|
Primary Objective | Ensure data accuracy by identifying and correcting known errors. | Continuously monitor data health and detect anomalies in real time. |
Monitoring Method & Frequency | Periodic, rule-based checks performed at specific stages of the data lifecycle. | Ongoing, automated monitoring of data pipelines in real time. |
Error Detection & Management | Identifies errors based on predefined rules (e.g., missing values, duplicates). | Detects unexpected anomalies using pattern recognition and proactive issues resolution. |
Use Cases & Data Scale | Suitable for structured databases and small-scale data cleaning projects. | Designed for large-scale, complex data ecosystems and cloud pipelines. |
Data quality management vs Data observability
How do you implement Data Observability?
Data observability is based on five fundamental pillars. These dimensions enable data quality to be monitored from different angles, issues to be detected and system performance to be maintained.
Pillar | Definition | Problems detected | Objective / Impact |
|---|---|---|---|
Freshness | This pillar measures the recency of the data. It checks that they are regularly updated. | Obsolescence, too important update times. | Ensure access to recent data. |
Distribution | This consists of assessing the accessibility and reliability of the data collected. | Inaccessibility, deviations from reliable sources. | Maintain representative data, avoid bias in analyses. |
Volume | Checks the quantity of data collected against expectations. | Fluctuating volumes, lack of completeness. | Identify collection issues to maintain overall integrity. |
Schema | It monitors the structure and organisation of the data. | Structural changes or interconnection problems. | Prevent different integration issues and ensure compatibility with processing systems. |
Lineage (Traceability) | This consists of following the path of a piece of data from its source to its use. | Damage at any stage in the pipeline, untraced changes. | Ensuring traceability and understanding the origin of errors to improve pipeline management. |
The five pillars of Data observability
The key stages in a successful strategy
A successful data observability strategy involves several key stages. In particular, organisations need to determine the data sources and metrics for optimal performance.
Define your monitoring requirements: list the key objectives (error reduction, compliance, optimisation of data pipelines) and the performance metrics to be monitored.
Identify critical data sources: list databases, content management systems, SaaS tools and cloud resources that are important for your business.
Implement tools tailored to your needs: adopt solutions capable of monitoring, diagnosing and correcting issues in your pipelines in real time.
Train your teams: make your employees aware of the importance of data quality and good observability practices.
Tools and technologies
Criteria for choosing your platform :
Ease of integration: the solution must be able to integrate easily with your existing data stack (data warehouses, ETL, BI tools).
Functionality: detection, alerting, advanced analytics, performance metrics monitoring, diagnosis and correction.
Scalability and price: check that the solution can handle increasing volumes of data while remaining within your budget.
Compliance and security: it goes without saying that you need to comply with security and confidentiality standards (GDPR, SOC2, etc.).
The main solutions on the market :
Monte Carlo
Monte Carlo stands out for its automated approach to monitoring data pipelines. It provides intelligent alerts and proactive issues detection across all data streams.
Sifflet
Sifflet is appreciated for its ease of use and clear interface. It focuses on metadata analysis and offers a complete view of pipelines with detailed diagnostics.
Datadog
Datadog is a comprehensive platform covering data observability, as well as infrastructure and application observability. Its strength lies in its ability to centralise IT and data supervision on a single interface.
Bigeye
Bigeye offers advanced monitoring and abnormal variation detection functionalities. It is particularly well suited to environments with complex and voluminous data flows.
There are many other solutions on the market, all with their own specific features: Grafana, CastorDoc, Acceldata, Splunk and Dynatrace.
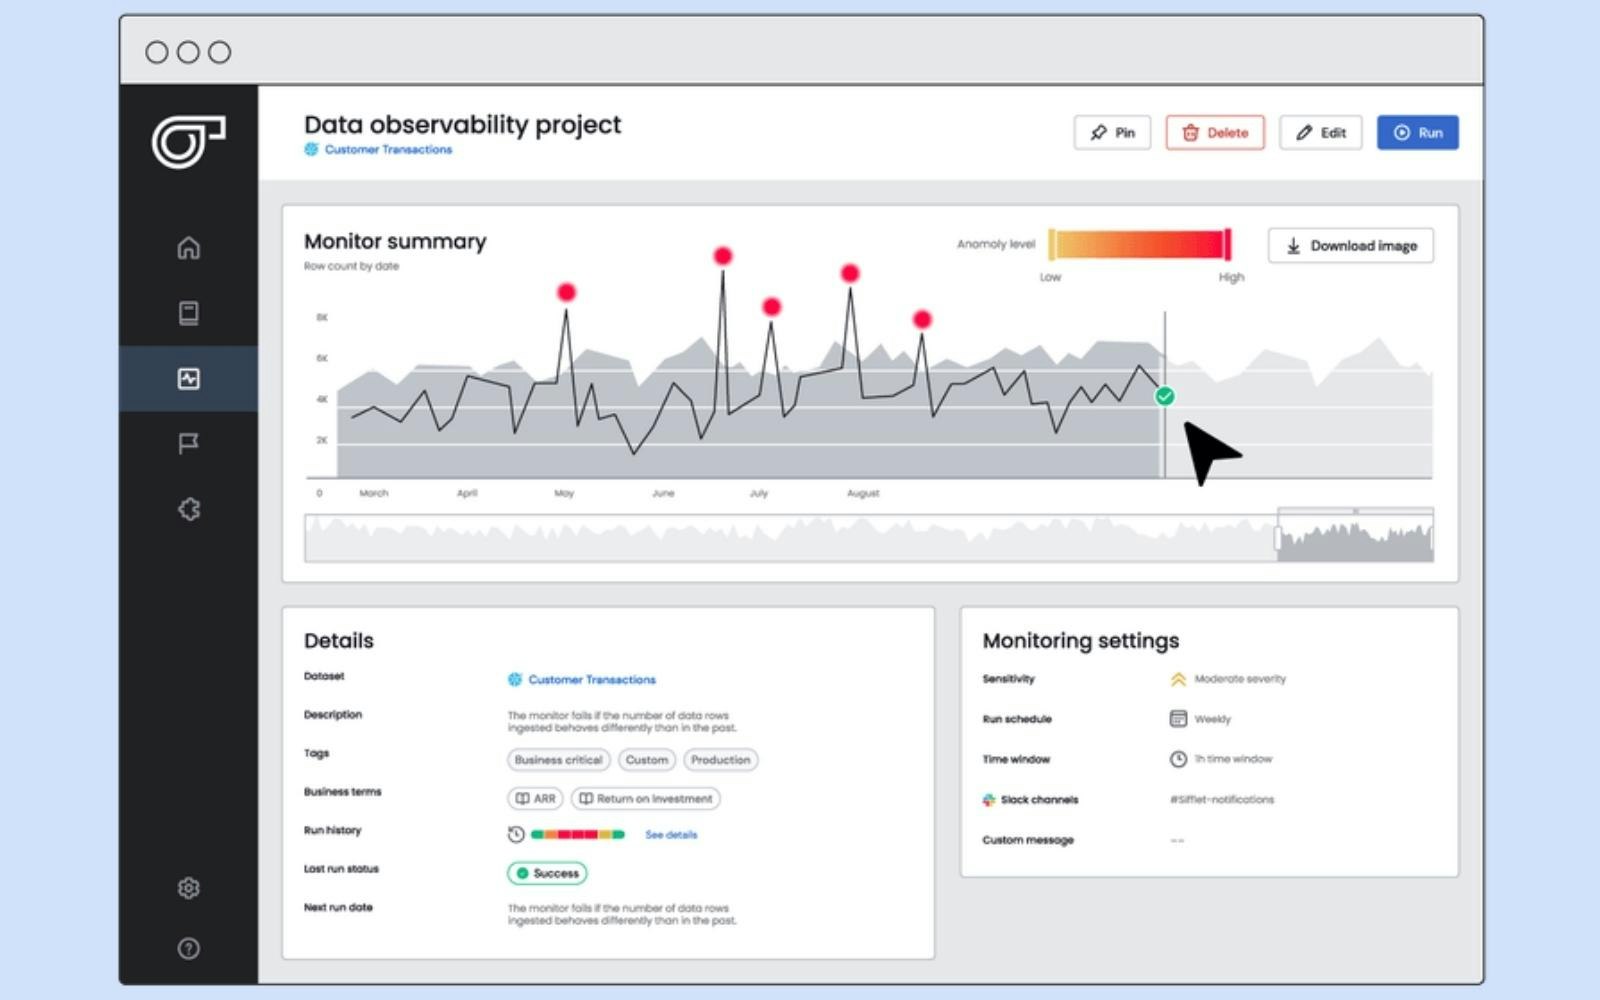
Sifflet Data Observability (Source: Sifflet)
Benefits and use cases
Data observability promotes collaboration between the data team and operational functions around a common objective of improving data flows.
Improved decision-making
In the e-commerce sector, reliable data allows rapid decision-making to personalise the user experience.
Thanks to data observability, teams can identify errors more quickly. As a result, they can offer consistent and appropriate product recommendations across all platforms.
Proactive detection of inconsistencies
Financial institutions handle large quantities of sensitive data. Using advanced algorithms, data observability ensures the integrity of the data streams used in financial reports.
This enables issues that could affect regulatory compliance and stakeholder confidence to be corrected immediately.
Optimising pipeline costs and performance
In the B2B SaaS sector, the quality of customer databases directly influences the effectiveness of marketing campaigns. Observability improves the efficiency of data pipelines by identifying bottlenecks.
It also identifies duplicates, data entry errors and obsolete information. In this way, it improves the performance of data pipelines and the effectiveness of acquisition and loyalty strategies.
Conclusion
Data observability is essential for guaranteeing reliable data, spotting issues in real time and optimising analytical processes. By ensuring continuous monitoring, it improves decision-making and reduces operational risks.
As an essential part of an MDS, it secures your data pipelines and ensures the accurate analysis that is essential to any data-driven strategy.
Contact us to find out more about our Reverse ETL solution, so you can activate your data with complete confidence!
FAQ
What are the main pillars of data observability?
The key metrics of data observability include freshness, distribution, volume, pattern and lineage.
Freshness assesses the timeliness of data, while distribution examines expected values to identify problems of accessibility and reliability.
Volume measures the extent of the data collected, while schema checks the consistency of the structure. Lineage, meanwhile, maps the origin and path of the data.
Together, these five concepts play a decisive role in monitoring and evaluating the quality, availability and reliability of data throughout the infrastructure.
What types of businesses benefit the most from data observability tools?
Data observability is essential for any business relying on large volumes of data across multiple systems and platforms. By improving the health of data pipelines, organisations in sectors like e-commerce, finance, and B2B SaaS benefit significantly.
In e-commerce, reliable data pipelines ensure accurate product recommendations and a better user experience. Data observability allows financial institutions to monitor the reliability of datasets used in reports.
Cloud-based SaaS businesses use it to help teams maintain data accuracy for better segmentation and campaign performance. By reading data insights more effectively, organisations can reduce errors and make better end-to-end decisions.
How can data observability improve collaboration between data teams and business units?
By setting a shared goal of improving real-time data reliability, observability enhances collaboration between data teams and business units. It provides a shared view of pipeline health and key metrics.
Business units can make informed decisions based on consistent, reliable data, while data engineers can proactively resolve issues. Clear reporting and automated alerts help teams stay aligned, reducing errors and delays.
By offering transparency and traceability, data observability fosters a data-driven culture where departments work together more effectively.
How do I know if my company needs a data observability solution?
Data observability is a sometimes overlooked component of a Modern Data Stack.
Here are a few questions to help assess your need for a data observability platform:
Do you process large volumes of data on a daily basis?
Do you encounter recurring errors in your reports or analyses?
Do your engineers spend too much time identifying and correcting issues?
Do you find it difficult to maintain the integrity and accuracy of the data you use?
Would you like to automate the monitoring of your data pipelines?
Challenges and limits of data observability
Complexity of deployment: deploying a data observability platform requires a good understanding of data flows and internal systems. Integrating tools and monitoring pipelines in real time can be technical and time-consuming.
Data-driven culture: observability requires your organisation to have a data-driven culture. It is essential to train teams, encourage collaboration between departments and use the data collected for decision-making.
Cost and maintenance of tools: advanced data observability solutions involve subscription, support and update costs, plus the cost of storing and managing data, particularly in cloud environments.
However, the long-term benefits in terms of performance and decision-making often outweigh these challenges.
*Source: Gartner


