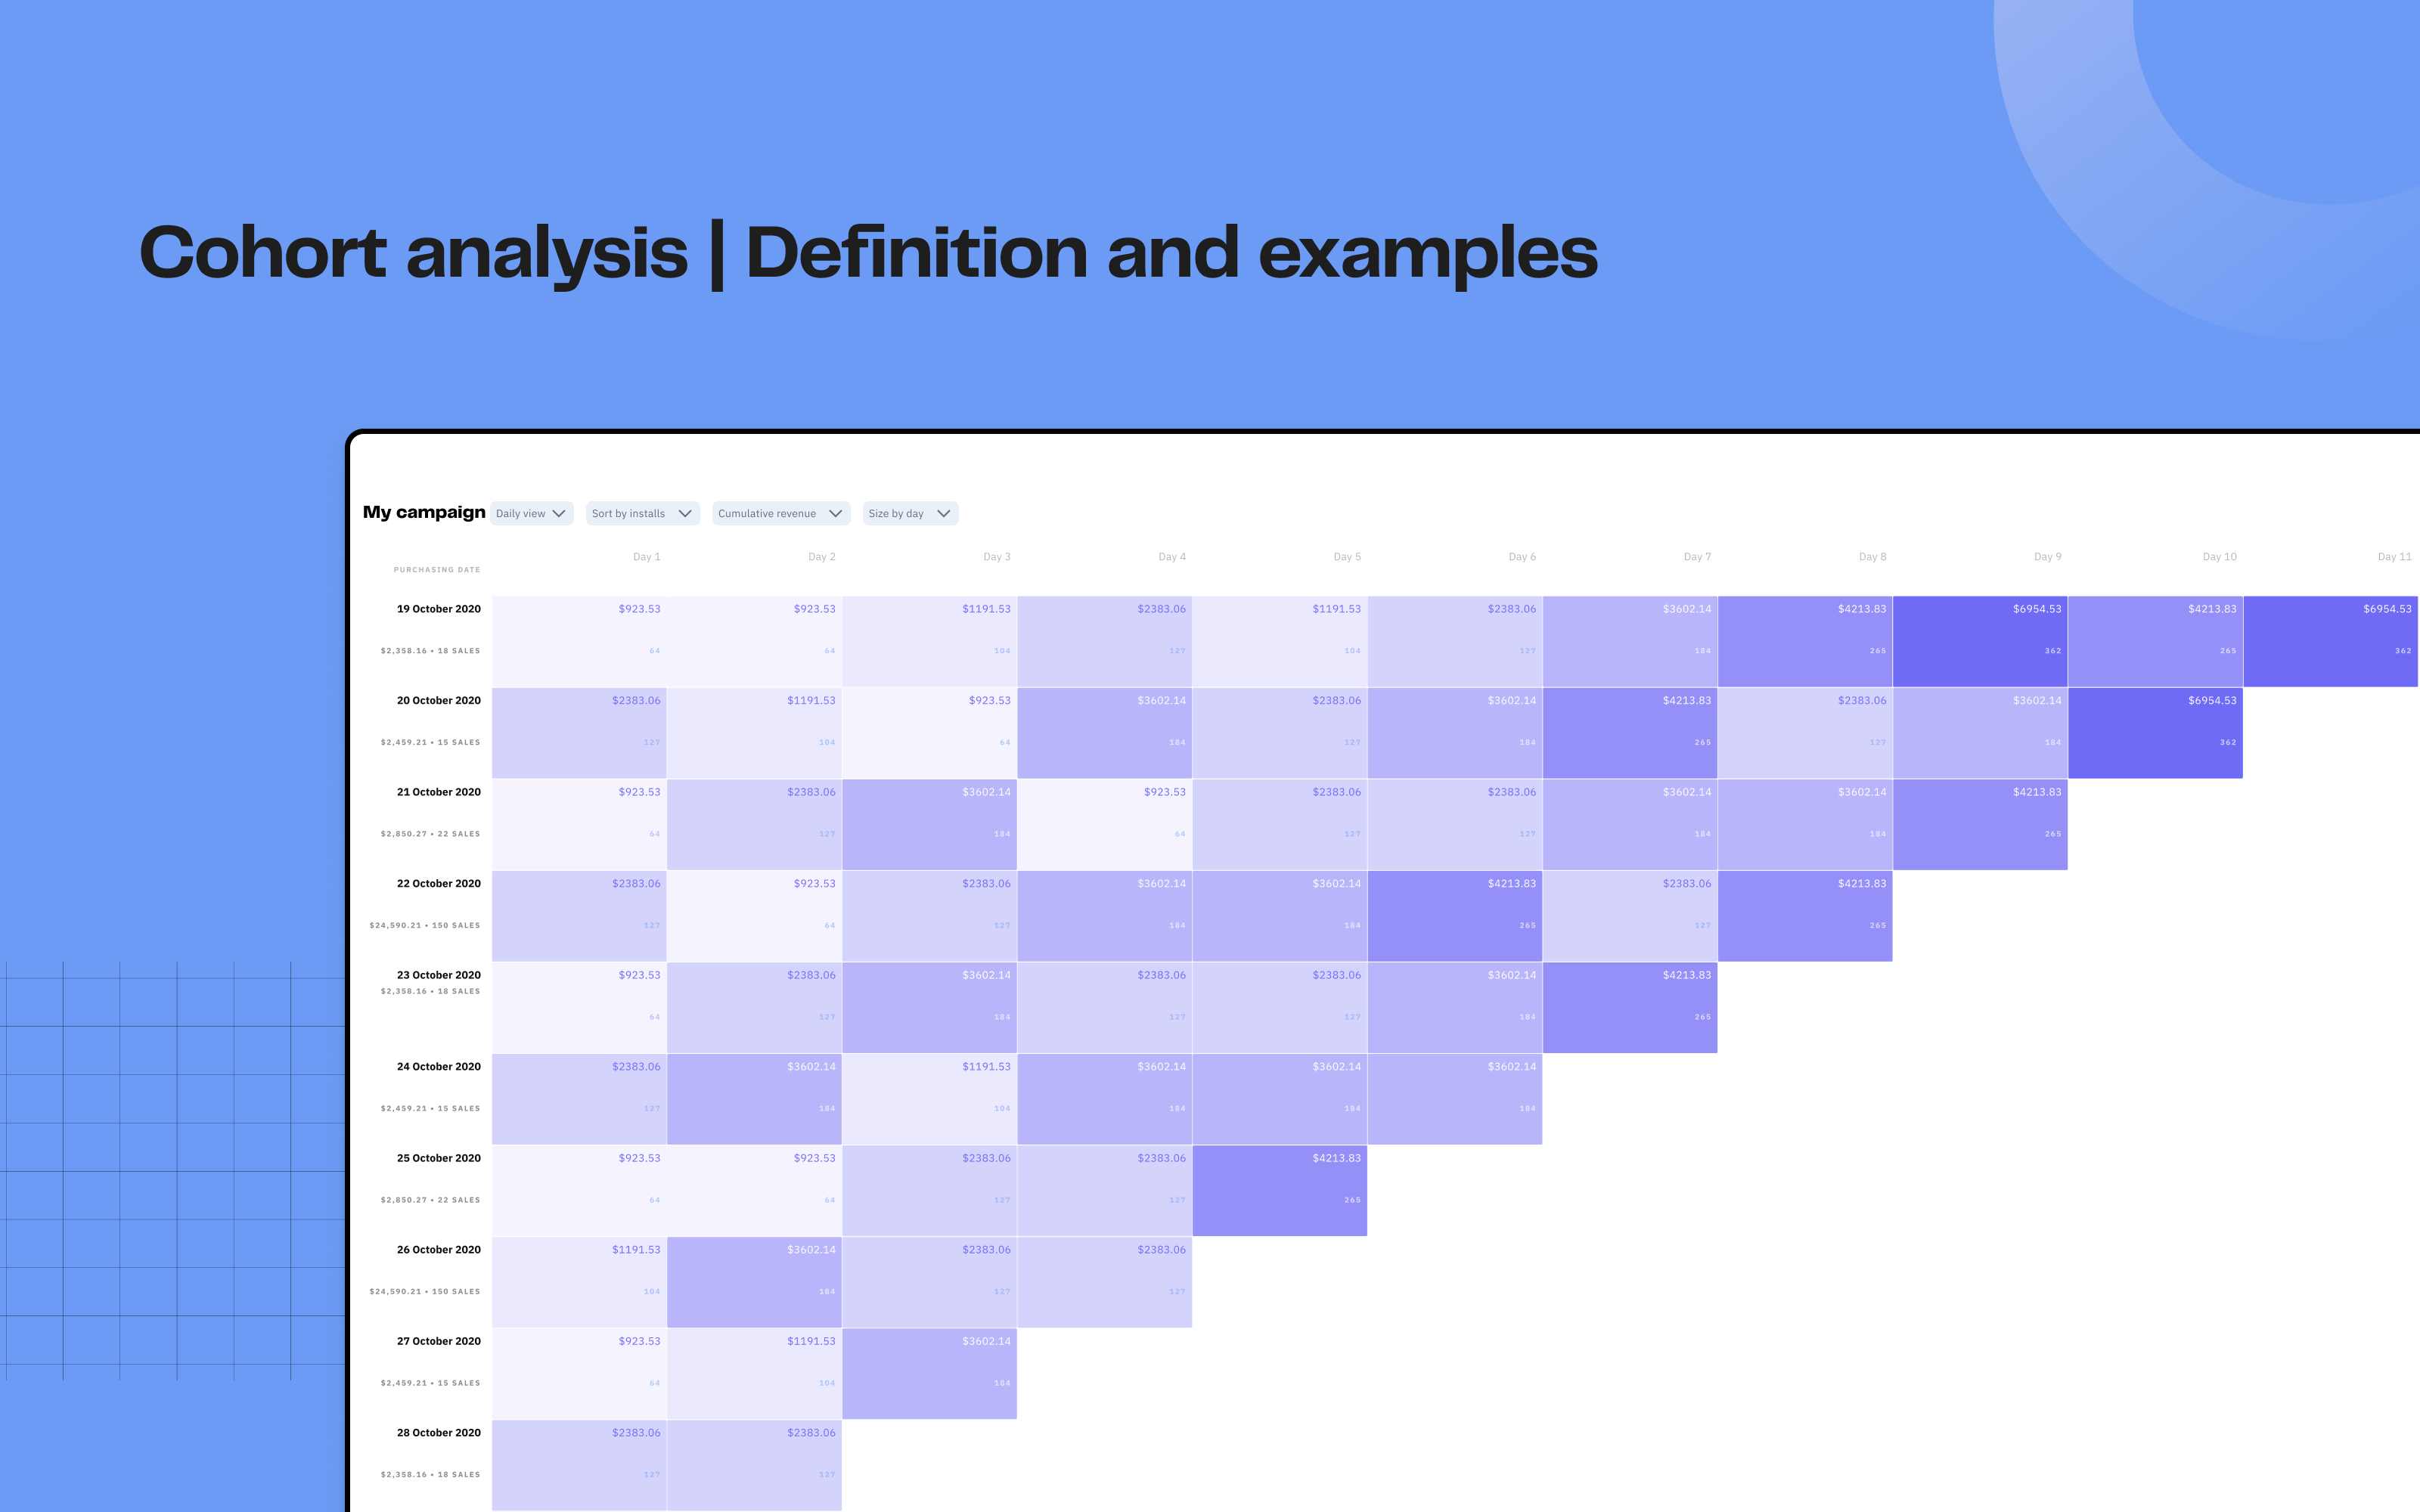
Improve customer engagement and retention thanks to cohort analysis
6min • Last updated on Sep 24, 2024

Alexandra Augusti
Chief of Staff
Customer segmentation refers to dividing your customer base into different groups that share the same characteristics or behaviors. Customer segmentation is very useful for understanding your market and especially for addressing the right audience at the right time.
Cohort analysis is a method of segmenting consumers limited in time. Indeed, when you perform a cohort analysis, you need to work with customer data from a specific period. It allows you to analyze the evolution of a group over time, particularly to determine key metrics for a company: retention rate, upsell rate, average basket, etc. By tracking specific cohorts over time, companies can better understand the data, identify trends and behavioral patterns over each month or week and so redefine targeted strategies.
Cohort analysis can be used by marketing, product, sales, or support teams to improve their daily operations. The overall goal remains to analyze past actions' results to improve the customer experience and therefore retention. Indeed, marketers can track specific cohort behaviors and identify points where user engagement drops, ultimately reducing churn.
What is Cohort Analysis?
Concretely, a cohort is a group of users, who share one or more common characteristics, that are tracked over time to analyze their behaviors and determine their lifetime value. A cohort is generally made up of customers who performed the same action (for example, a subscription) or received the same solicitation over the same period.
This helps businesses create data-driven strategies based on precise analytics.
For example, a cohort can be:
All customers who made their first purchase in January 2024
All customers who made their first purchase in January 2024, in-store
All customers who made their first purchase in January 2024, in-store, in France
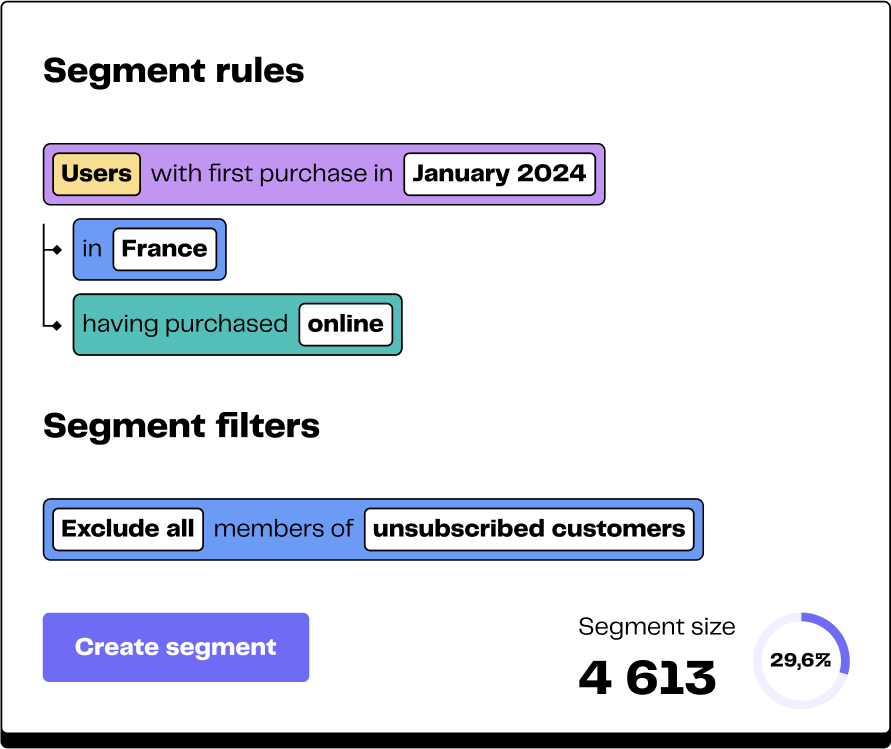
Cohort analysis can be exploited by marketing, product, or sales teams to measure and understand how their initiatives influence user or customer behavior. Cohort analysis is mainly used to optimize customer retention by analyzing the churn rates of various cohorts, classified according to different criteria such as acquisition date or acquisition channel.
One additional benefit of cohort analysis is its ability to isolate patterns within user lifecycles that might not be apparent from broad data sets, allowing companies to optimize customer retention by identifying the exact points in the customer journey where engagement drops off. By tracking these trends, businesses can develop strategies that improve retention and reduce churn over different time periods, like the first week or month of interaction.
More broadly, it also allows you to analyze marketing results by comparing key KPIs for each cohort or evaluating the adoption of new product features. These metrics help understand the performance of different campaigns and product updates, offering insights to create better strategies.
Criteria Used in Cohort Analysis
Cohort analysis is mainly used by retail/e-commerce companies or those operating on a subscription model, both B2C and B2B.
Cohort analysis always takes into account the temporal aspect, but some segmentation criteria can be added to refine the results.
Depending on your company's activity, different criteria are more or less relevant:
Temporal criteria such as registration date or purchase date.
Geographical criteria such as country or city.
Acquisition criteria, such as the channel or the specific campaign (especially for B2B commercial offers)
Behavioral criteria, such as the number of visits or time spent on the product (especially for SaaS).
The choice of criteria essentially depends on your specific objectives, your sector, your audience, and your offer. Do not rush into an analysis but first seek to identify the relevant criteria in your case.
Behavioral cohort analysis allows understanding not just when a user takes action but why they take specific actions, providing valuable insights for determining key churn triggers and better retention strategies. By tracking user behavior patterns, businesses can identify factors affecting metrics like revenue and customer satisfaction.
A Concrete Example of Cohort Analysis
Consider, for example, a gym looking to understand the conversion dynamics of its "basic" plan into "premium" plan. The "basic" membership provides standard access to the gym and its equipment, while the "premium" membership offers additional benefits.
The ultimate goal of the gym is to retain and convince its "basic" members to upgrade to the "premium" plan, which is more profitable for them.
Without cohort analysis, it is difficult to track the conversion rate of "basic" memberships to "premium" memberships.
💡 We would likely try to use a formula like:
(# Premium” subscribers who were previously “basic” / # “basic” Subscribers) * 100
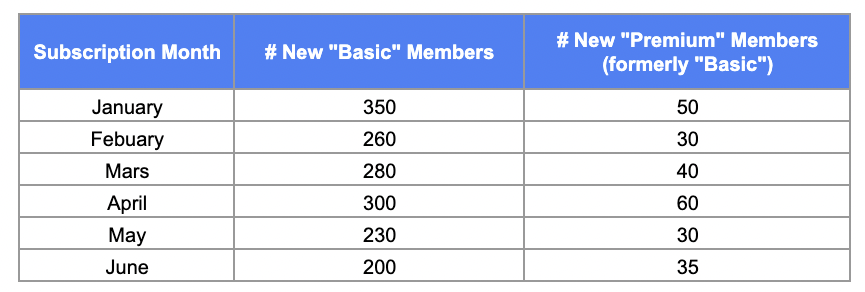
Illustration - Basic and Premium Memberships
Here, we would have a conversion rate of 50/350 = 14%
However, among all the new “premium” members in a given week, there are those who signed up for this plan in the same month, but also the “basic” members, who signed up 1, 3, or 6 months ago and upgraded their plan.
Thus, to analyze the conversion rate of the plans, the gym will apply a cohort analysis, tracking the behavioral evolution of customers since their subscription.
They will create monthly cohorts, such as:
The January 2024 cohort: customers who signed up in January 2024.
The February 2024 cohort: customers who joined in February 2024.
And so on for the following months.
Then, they will examine the conversion rate to the "premium" membership for each cohort at different times (M+1, M+3, M+6, etc.), allowing a fine analysis of the evolution of subscription behavior.
Returning to our example, we realize that 87 “basic” members eventually converted to premium, according to this timeline:

Switch from "Basic" to "Premium" Plans
Thus, the 6-month conversion rate for the January 2024 cohort is 25%.
Thanks to its cohort analysis, the gym can compare the performance of different cohorts, identify the factors influencing conversion to more advantageous memberships, and refine its marketing strategy for optimal customer retention and LTV. By tracking these trends using detailed reports, they can understand what drives user behavior and make data-based decisions.
One concrete example: by performing cohort analysis, the gym could segment its users further to diagnose the precise period when "basic" members often upgrade to "premium" memberships and develop targeted campaigns accordingly. By examining metrics over different periods, say week or month, the gym can pinpoint when specific actions, like plan upgrades, most frequently occur.
How to Take Advantage of Cohort Analysis
Far from being a simple statistical tool, cohort analysis is an effective action lever. It offers the possibility to decipher data and transform it into powerful marketing strategies based on specific user behaviors and time periods. By identifying exact user needs, businesses can enhance customer experiences and improve overall engagement.
Here are some use cases where it is relevant:
Case 1: Decipher Purchase Periodicity to Choose the Best Time for a Follow-Up
If your product or service encourages repeat purchases, it is crucial to understand the purchase frequency of customers, allowing you to define the optimal time for effective follow-ups. By analyzing user behavior patterns over a specific period, such as day or week, you can better track when users are likely to buy again and develop precise follow-up strategies.
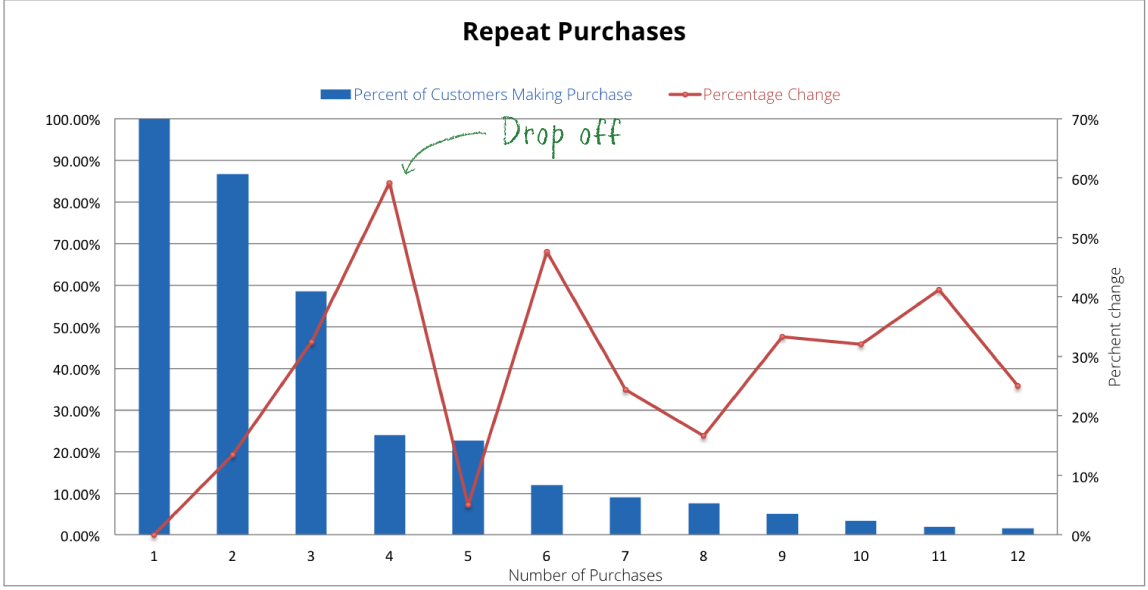
Imagine selling credits on a web application. By segmenting customers by first purchase date and tracking their repurchase rate over several periods, you can determine the perfect time to send a reminder email. This email could include a dedicated promotion or recommendations for using the credits, making the experience more personalized.
Case 2: Assess the Impact of a New Loyalty Program or Targeted Promotions
Introducing a loyalty program or specific promotions often appears as a good way to encourage repeat purchases. However, some discounts are sometimes unnecessary.
Cohort analysis helps measure the effectiveness of these initiatives on purchasing behavior. For example, by offering a 25% coupon after the third purchase, you can analyze its effects by creating cohorts based on this criterion and comparing various indicators (repurchase rate, average basket value, acquisition cost, lifetime value) between customers who received the offer and those who did not.
This allows you to evaluate the effectiveness of the operation and adjust the strategy to optimize ROI. You might find that even without promotion, customers remain loyal, and the promotion is therefore unnecessary.
Case 3: Optimize Acquisition Budget by Targeting Effectively
Cohort analysis is essential for identifying the most effective channels and the most profitable ones. For example, by running ads on Facebook, Google, Instagram, and LinkedIn, it is wise to create cohorts by acquisition channel to analyze the conversion rate, acquisition cost, retention rate, loyalty, and lifetime value of customers obtained through each channel.
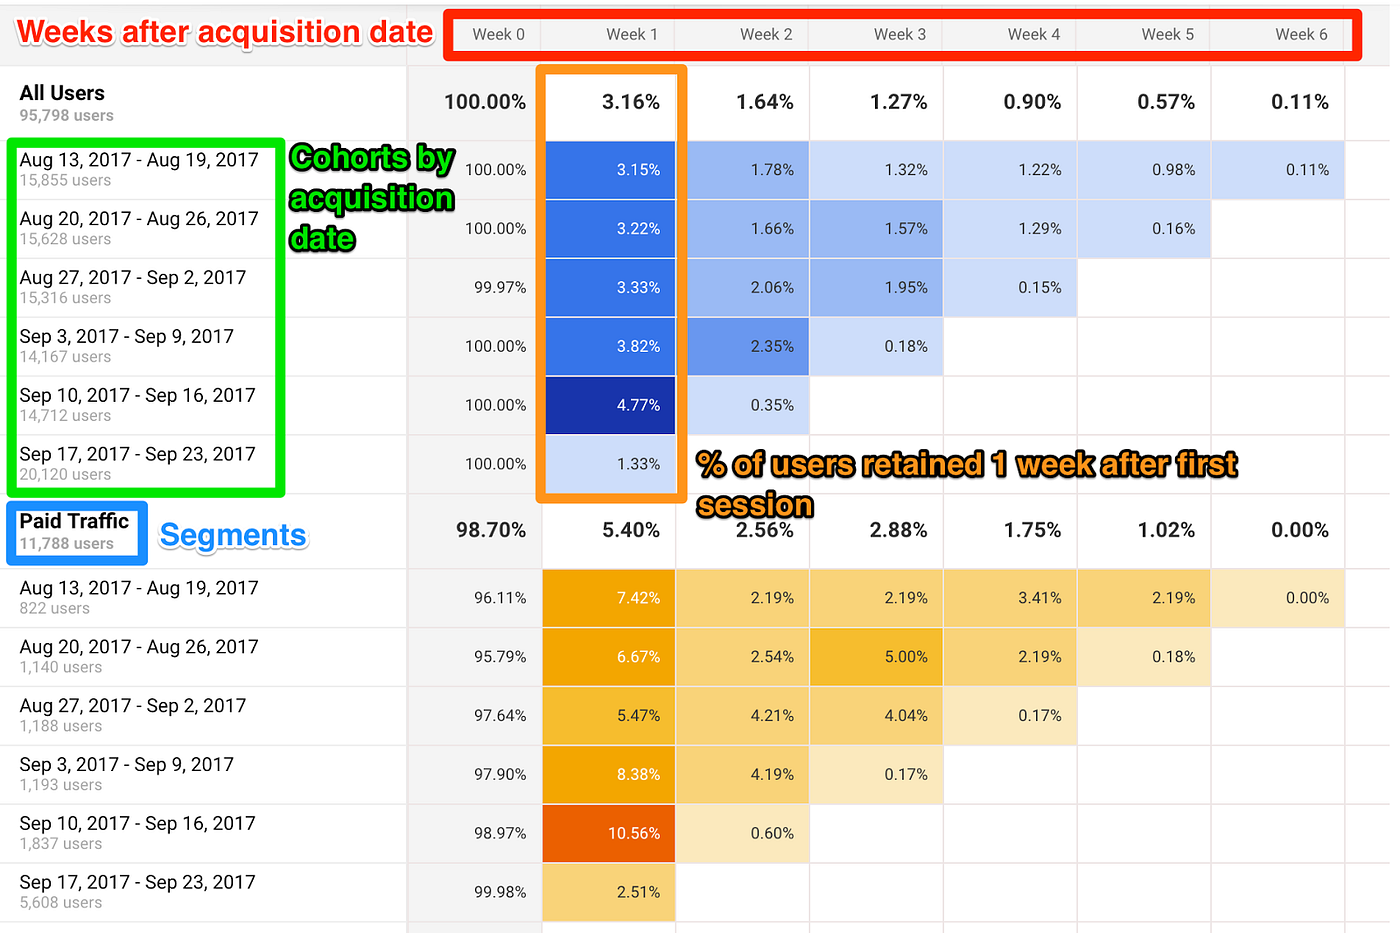
Image credit: Medium @Patrick Han
With these insights, you can reallocate your acquisition budget to the channels that provide the best customers, i.e., those who are the most engaged, loyal, and profitable.
How to Implement Cohort Analysis?
There are several methods to set up a cohort analysis on your customer base. However, regardless of the chosen method, you must first identify the type of cohorts to analyze (by acquisition sources, marketing campaigns, etc.) and clarify the hypothesis you want to validate (e.g., a promotional code promotes repurchase). This initial data preparation helps create an effective analysis framework, ensuring accurate metrics tracking and valuable insights.
Then, you can conduct your cohort analysis:
By using a spreadsheet (Excel or Google Sheets) and building a custom reporting model. Cohort analysis templates exist on the internet and are fairly easy to handle. However, analytical capabilities are quite limited.
By using Google Analytics reports, which offer detailed reports and allow you to choose the analyzed metric. However, the cohort is always based on the first interaction of a user with your website.
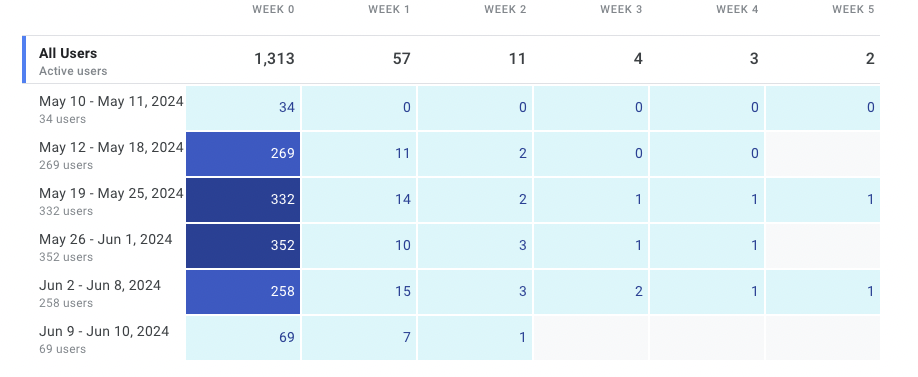
Illustration - Google Analytics Cohort Analysis Report
By asking your data team to perform the analysis directly in your database. You can perform any analysis, but you are unfortunately not autonomous, and the analysis may take time.
By using a tool, such as a Customer Data Platform (CDP) that allows customized cohort analyses. CDPs enable analyses based on data aggregating online and offline sources and activate results in real-time in business tools (to automatically trigger the right marketing/CRM campaigns).
Conclusion
In summary, analyzing cohorts allows you to precisely measure the evolution of a specific metric for a defined group over time, facilitating the visualization of behavioral evolution and the identification of key factors driving customer satisfaction, loyalty, and profitability. By tracking these metrics, businesses can improve retention strategies and optimize marketing efforts based on specific user behaviors.
Analyzing results and adjusting marketing campaigns accordingly is key to improving performance.
If you need help with customer segmentation or/and cohort analysis, feel free to contact us.


