Retention rate: definition, formula and strategies
5min • Last updated on Mar 3, 2025


Alexandra Augusti
Chief of Staff
The retention rate is a critical indicator for businesses, revealing their ability to maintain customers over the long term. It measures the percentage of customers who remain loyal to a company's products or services and identifies those who are lost.
Understanding and improving your retention rate is crucial, as it can significantly influence a company's prosperity, turnover and the lifetime value of its customers.
👉🏼 This article offers a detailed understanding of the retention rate, including:
its definition,
the calculation method
common pitfalls to avoid
and strategies based on customer audiences for improvement.
Additionally, we provide insights into other key indicators (KPIs) for evaluating customer satisfaction and loyalty.
Definition
The retention rate is a key indicator of customer or employee loyalty over a specified time frame. This metric reveals the percentage of customers or employees who stay engaged with your brand over the period, as opposed to those who are lost.
To calculate it, you simply need to divide the number of remaining customers (or employees) at the end of the period by the initial number, excluding any new arrivals.
This metric applies to both customers and employees and is based on a common principle: give priority to maintaining relationships 🔐 with those who have already chosen your company over continually trying to attract new ones.
💡 While this article focuses on customer retention, the formulas and strategies (slightly adapted for the workplace) are applicable to employees and can be adjusted to meet your specific needs.
Why Customer Retention is essential
Emphasizing customer retention is crucial for boosting your turnover and increasing profitability. Retaining your current customers is indeed more cost-effective than acquiring new clients.
Several studies demonstrate that a 5% increase in customer retention can lead to a profit increase of 25% to 95%. While the exact figure varies, all studies agree on this scope.
🤔 But why?
Loyal customers also tend to recommend your brand, share their opinions (potentially bringing in new customers convinced by their peers), and try your new products (acting as beta users). They thus become key players in your business development and the enhancement of your reputation.
It is essential to carefully analyze your retention rate:
If it is increasing, how can you ensure to maintain this growth and keep your customer base loyal?
If it is decreasing, what are the reasons and what strategies should be implemented to improve it?
In both cases, it is necessary to compare this evolution with the modifications (in marketing strategy, product/service, customer relationship, etc.) made by the company during the same period, to understand what works and what does not.
Calculating the Retention Rate
Generic approach
Calculating the retention rate is quite straightforward! Apply the following formula:
Retention Rate = (Final Customers - New Customers) / Initial Customers * 100
This formula takes into account:
Final Customers: the number of customers at the end of the observed period (e.g., December 31).
New Customers: the total of customers acquired during the observed period (e.g., from January 1 to December 31).
Initial Customers: the number of customers at the beginning of the observed period (e.g., January 1).
👉🏼 Imagine you start the year with 100 customers, gain 50 during the year, and end up with 120 customers on December 31, the calculation would be:
Retention Rate = ((120 - 50) / 100) * 100 = 70%.
This implies that you have managed to retain 70% of your initial customers over the period. To determine the attrition rate, which is the inverse of the retention rate, simply subtract the retention rate from 100%. In our scenario, the attrition rate would therefore be 30%, indicating a loss of 30% of the initial customers during the period.
⚠️ Note that the period to consider depends on your product's sales cycle and will therefore differ for each business. If you sell cars, do not worry if you have not seen a customer for six months. On the other hand, if you sell basic necessities, it is very likely that your customer has checked out the competition.
Cohort methodology
A more precise approach to calculating the retention rate involves using a cohort method, which classifies your customers according to their first purchase date and analyzes retention by group over a specific interval.
Comparing the retention rate of customers who made their first purchase at different times (January, February, March, etc.) helps to observe the evolution of the retention rate in relation to the marketing strategies deployed or changes to your products/services.
Analyzing the retention rate by customer segments is also wise, especially if your offering includes a variety of products or services, and targets different customer personas. This allows you to measure the retention rate of customers according to the type of product purchased (product A, product B, etc.).
This enables you to determine which products or services best retain customers and identify the most loyal customer segments.
Note that customer analysis can be done according to other segmentations in addition to the product category. For example:
Marketing Channel: This is one of the best ways to know the most effective channels (i.e., with the highest LTV) and measure your marketing ROI.
Socio-demographic data: You can determine the age, sex, job, or geographical area of your most loyal customers.
Common mistakes to avoid
In most sectors, competition is fierce. To carve out a space in the market and retain your customers, it is essential to offer a personalized and omnichannel experience to each of your clients. Here are some mistakes to avoid:
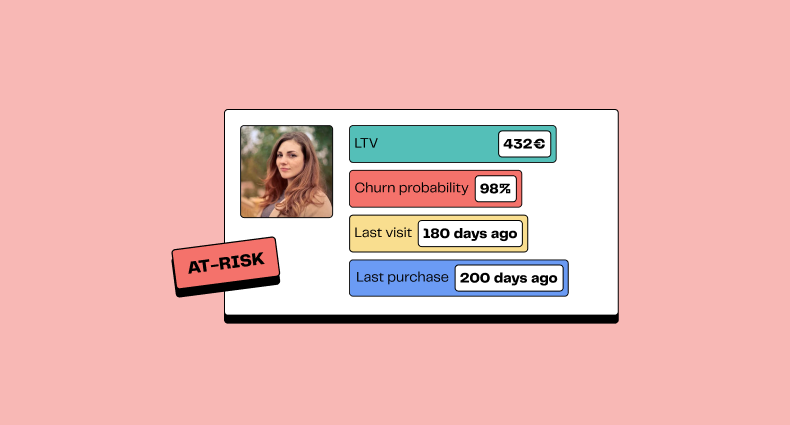
Not knowing your audience: Understanding who your customers are, their needs, expectations, motivations, and what holds them back is essential. Segmenting your clientele is crucial and must be based on significant criteria such as age, sex, or purchasing behavior. For a more comprehensive analysis, you can even use RFM analysis, based on recency, frequency, and monetary value.
💡 This knowledge will allow you to adjust your offer and communication accordingly. Ignoring who your audience is can lead you not to meet their needs and, consequently, to lose them.
Not offering quality customer service: A responsive, efficient, courteous, and personalized customer service is a pillar of loyalty. Neglecting this aspect can lead to disappointment and frustration of your customers, potentially pushing them to turn to the competition. Ensure that your customer service reflects your promises and values.
Not offering enough incentives: To maintain your customers' engagement, offer them benefits, rewards, surprises, etc., through loyalty programs, discounts, gifts, or exclusive content. Few incentives could weaken the emotional bond with your customers and leave them indifferent.
Not communicating effectively: Maintaining contact with your customers through tailored communication (email, SMS, social media, etc.) is crucial. Relevant, regular and personalized messages are essential to inform them, reassure them, and solicit their loyalty. Do not hesitate to encourage your customers to follow you on social media but be careful to offer high-value content! Poor communication can lead to loss of contact, forgetting customers, or even irritating them if the frequency is too high.
Not collecting and using customer data: Customer data, collected ethically and legally (i.e., in accordance with GDPR/CNIL regulations), constitutes a goldmine of information for improving your services, offers, and customer relationship.
Analyzing, exploiting, and activating it in your tools is indispensable. Omitting this step can lead to missed opportunities, insufficient personalization of the relationship, or a breach of trust.
Not testing loyalty marketing activities: Testing, measuring, and optimizing your loyalty strategies is essential to identify the most effective ones. Define specific goals, performance indicators, methods, and evaluation tools to avoid scattering or wasting your resources.
Not adapting to change: In a constantly evolving market, innovation, agility, and adaptability are essential. Remaining static can cause you to lose your competitive edge, make your offer obsolete, and cost you customer loyalty.
Other Key Marketing KPIs
The retention rate is an important metric, but it is not the only one to consider for measuring the success of your marketing initiatives. Several other KPIs (Key Performance Indicators) are essential for assessing the effectiveness of your strategies in terms of customer satisfaction, loyalty, and profitability. Here is an overview of these indicators:
Attrition Rate (also known as Churn Rate): Corresponds to the percentage of customers who stop purchasing your products or services over a defined period. To calculate it, divide the number of lost customers by the total number of initial customers, then multiply by 100.
This KPI being the opposite of the retention rate, a high attrition rate can have a negative impact on your revenues and your brand.
Churn Rate = (Number of Lost Customers / Total Number of Customers at the Start of the Period) × 100
Revenue Growth: Represents the rate of change of your sales over a determined interval. Calculate it by subtracting the previous period's revenue from the current one, divide the result by the previous revenue, and multiply by 100. Revenue growth indicates an increase in revenue generation, possibly via the acquisition of new customers, an increase in average basket size, or an increased purchase frequency. Focus on understanding the causes of this increase to implement a sustainable strategy.
Revenue Growth = [(Revenue Previous Period - Revenue Current Period) / Revenue Previous Period] * 100
Net Promoter Score (NPS): This indicator assesses the likelihood of your company being recommended by your customers. Calculated by subtracting the percentage of detractor customers (rating of 0 to 6) from that of promoter customers (rating of 9 or 10), the NPS ranges between -100 and +100. A high score signals a high level of customer satisfaction. In addition to remaining loyal to your brand, these customers will therefore be more inclined to recommend you to their acquaintances. Your customers can become the best advertisement for your business!
Re-purchase Rate: Indicates the percentage of customers making a new purchase after a first. To determine it, divide the number of customers who have made at least two purchases by the total number of customers, then multiply by 100. A high re-purchase rate demonstrates the quality of your products or services and your customers' loyalty to your brand.
Re-purchase rate = (Number of Customers with at least 2 Purchases / Total Number of Customers) * 100
Lifetime Value (LTV): This measure corresponds to the average revenue generated by a customer throughout their lifecycle. There are several calculation methods (which we detail in our guide on LTV), but all seek to compare the customer acquisition cost versus customer retention.
⚠️ This article champions customer retention, but acquisition remains an important growth lever for a business.
Conclusion
The retention rate plays a crucial role in assessing the loyalty of your clientele as well as the profitability of your company. This indicator not only reveals the number of customers you manage to retain but also those you lose and the underlying reasons.
By understanding the evolution of your retention rate, you can refine your loyalty strategies. This indicator guides you through the best practices to adopt, pitfalls to avoid, and expected results.
🚀 About us: DinMo is at the forefront of the next generation of Customer Data Platforms with its Composable CDP. We enable marketing teams to increase their retention rate and the overall Customer Lifetime Value. For more information about DinMo, contact us!